What do you mean by better quality of graph pictures? If you're talking about 2D string diagrams/box and wiring diagrams/ or functorial box/tube diagrams a la Meilles or McCurdy, I agree! If there is something else you have in mind, I am curious!
Can you give me some examples of articles we could improve, and describe what you'd like to see?
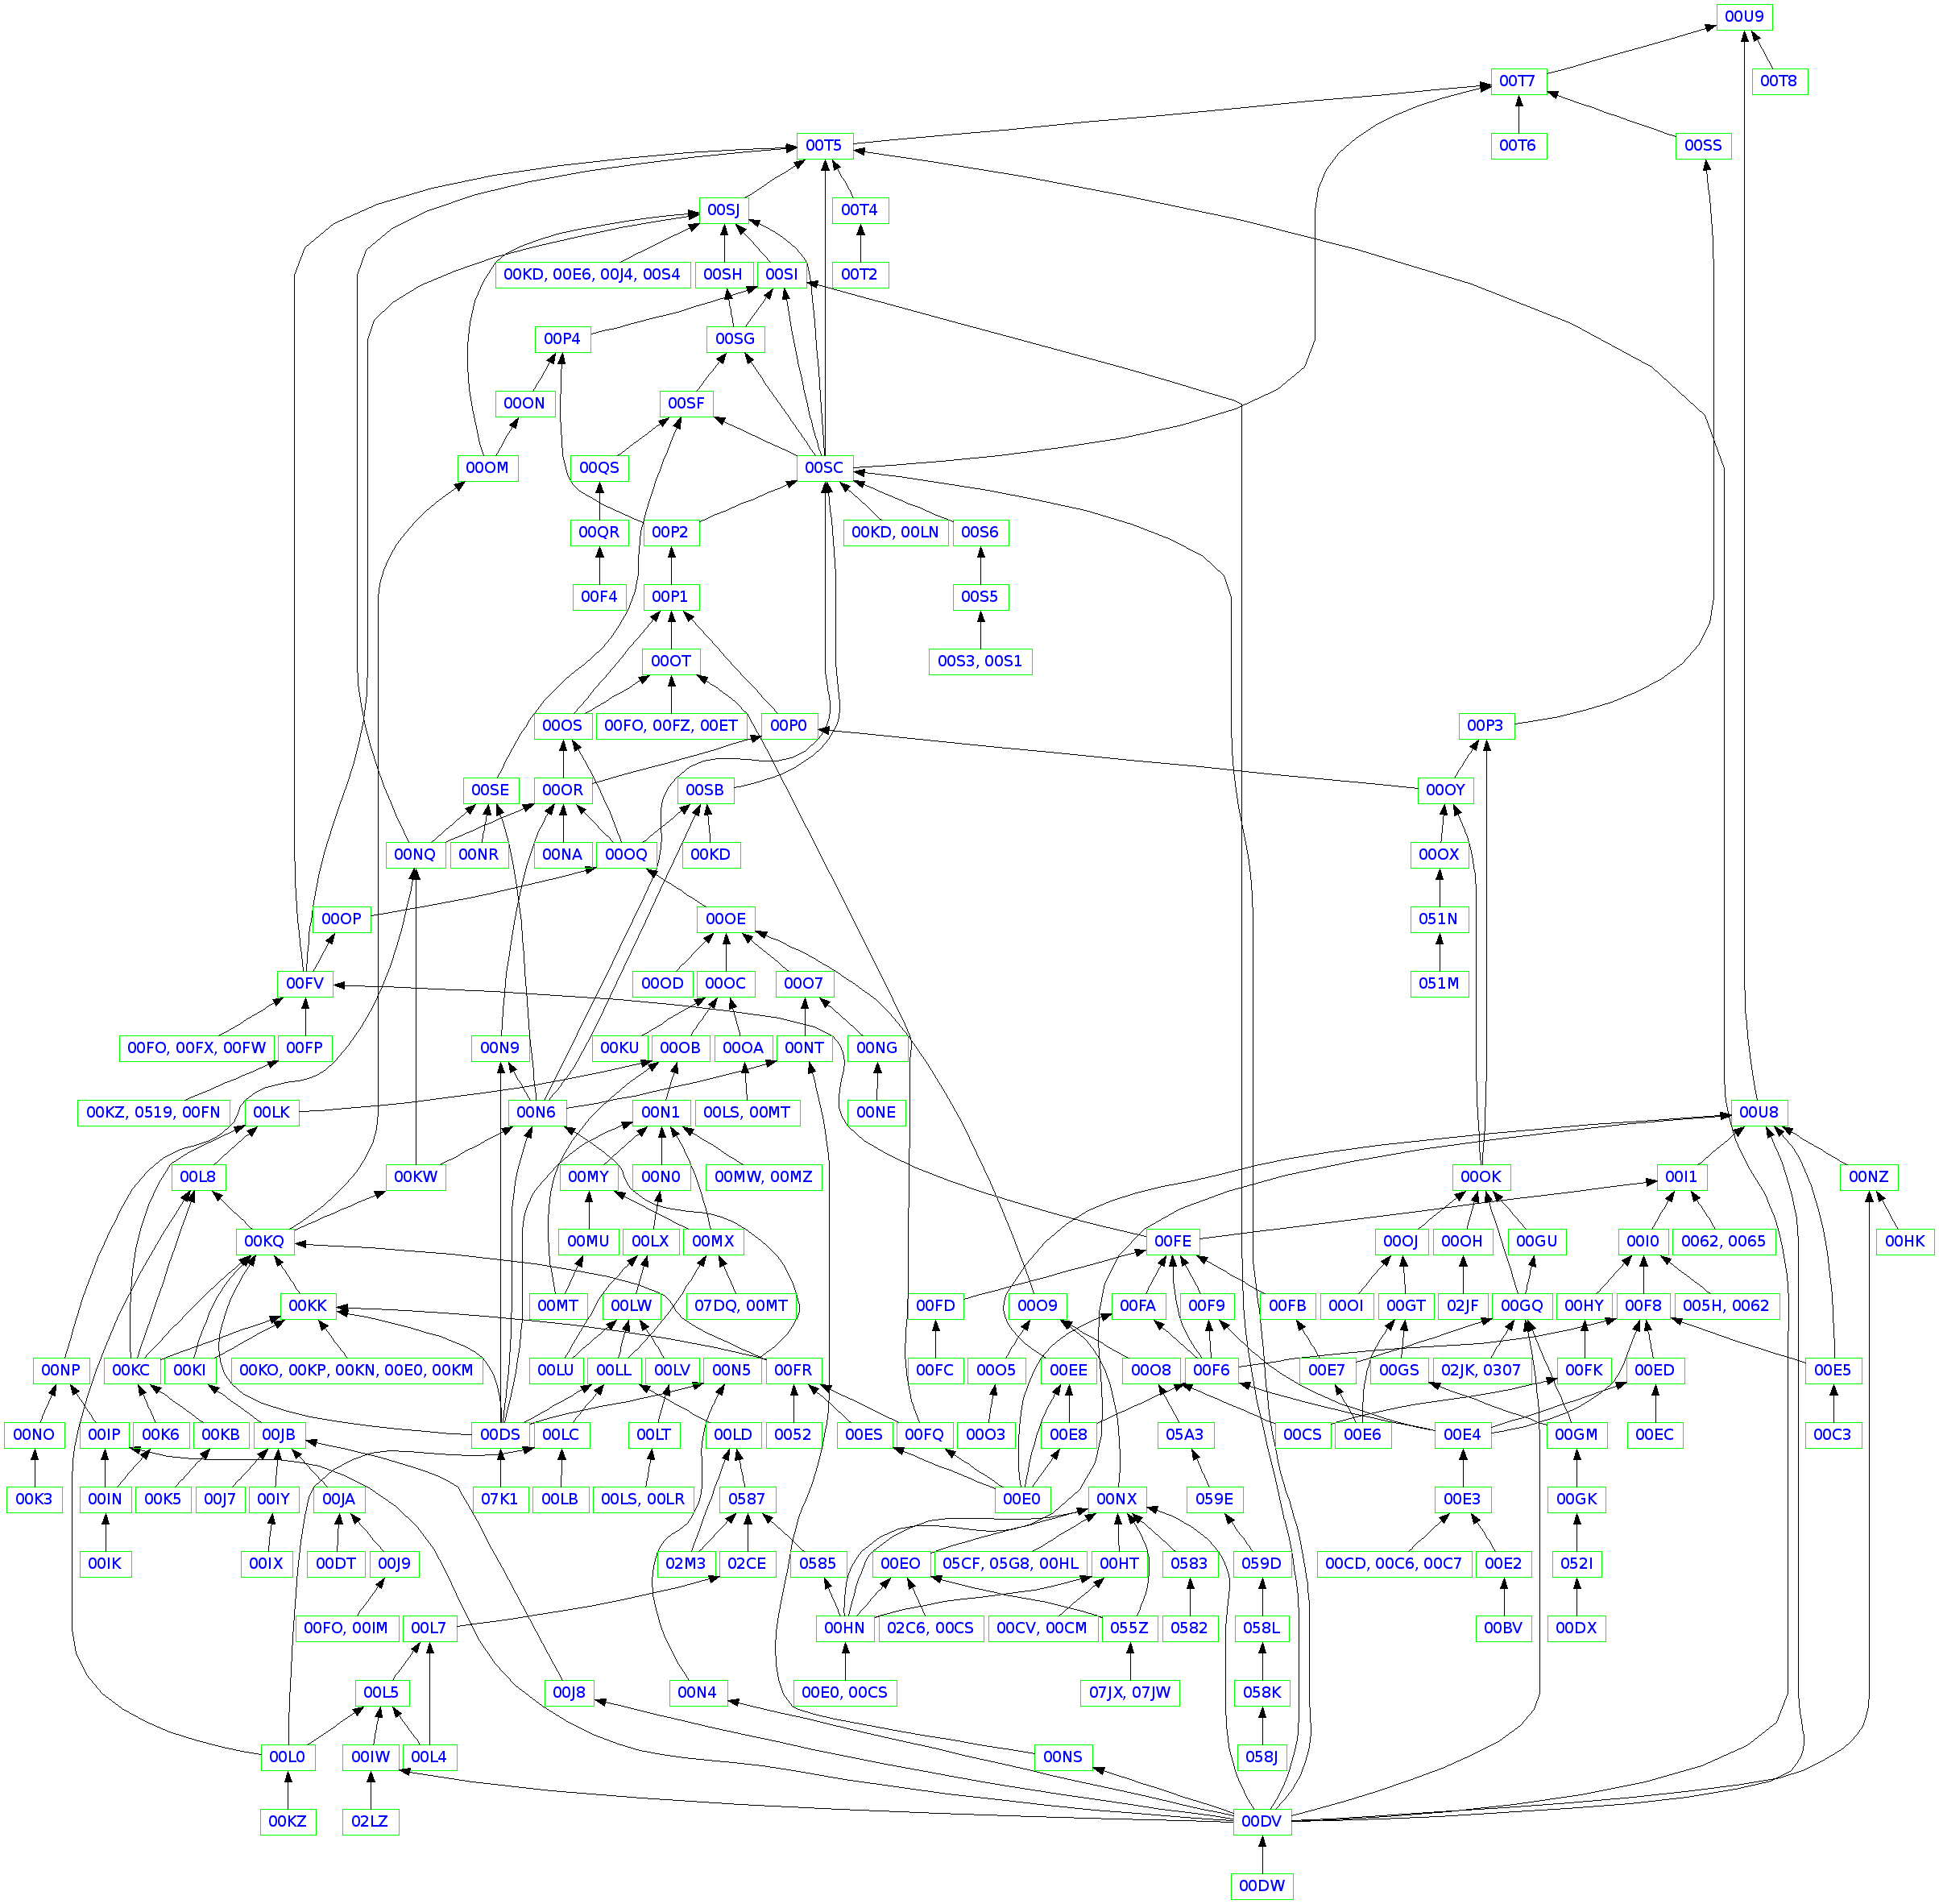
For example, I want to see any text on the picture named "An alternative visualization of how the Cohen structure theorem and related concepts intersect. " Seems it has to be a way to see high-res but a click doesn't work.
Those PNG thumbnails don't have any higher resolution, they're literally there as examples of what users of The Stacks Project produce as visualisations using the lemma tags:
Oh those images aren't from the project itself. The news article just uses some pictures from some of the blog posts that are at a meta level about the project. From a reverse image search that specific image can be found on this post: